Making an Even-More-Useful COVID-19 Tracker with Node.js
Imagine an artist transferring the clutter of her studio directly to the canvas. When we query an API or database, we often transfer that clutter to the user interface. There is a better way.
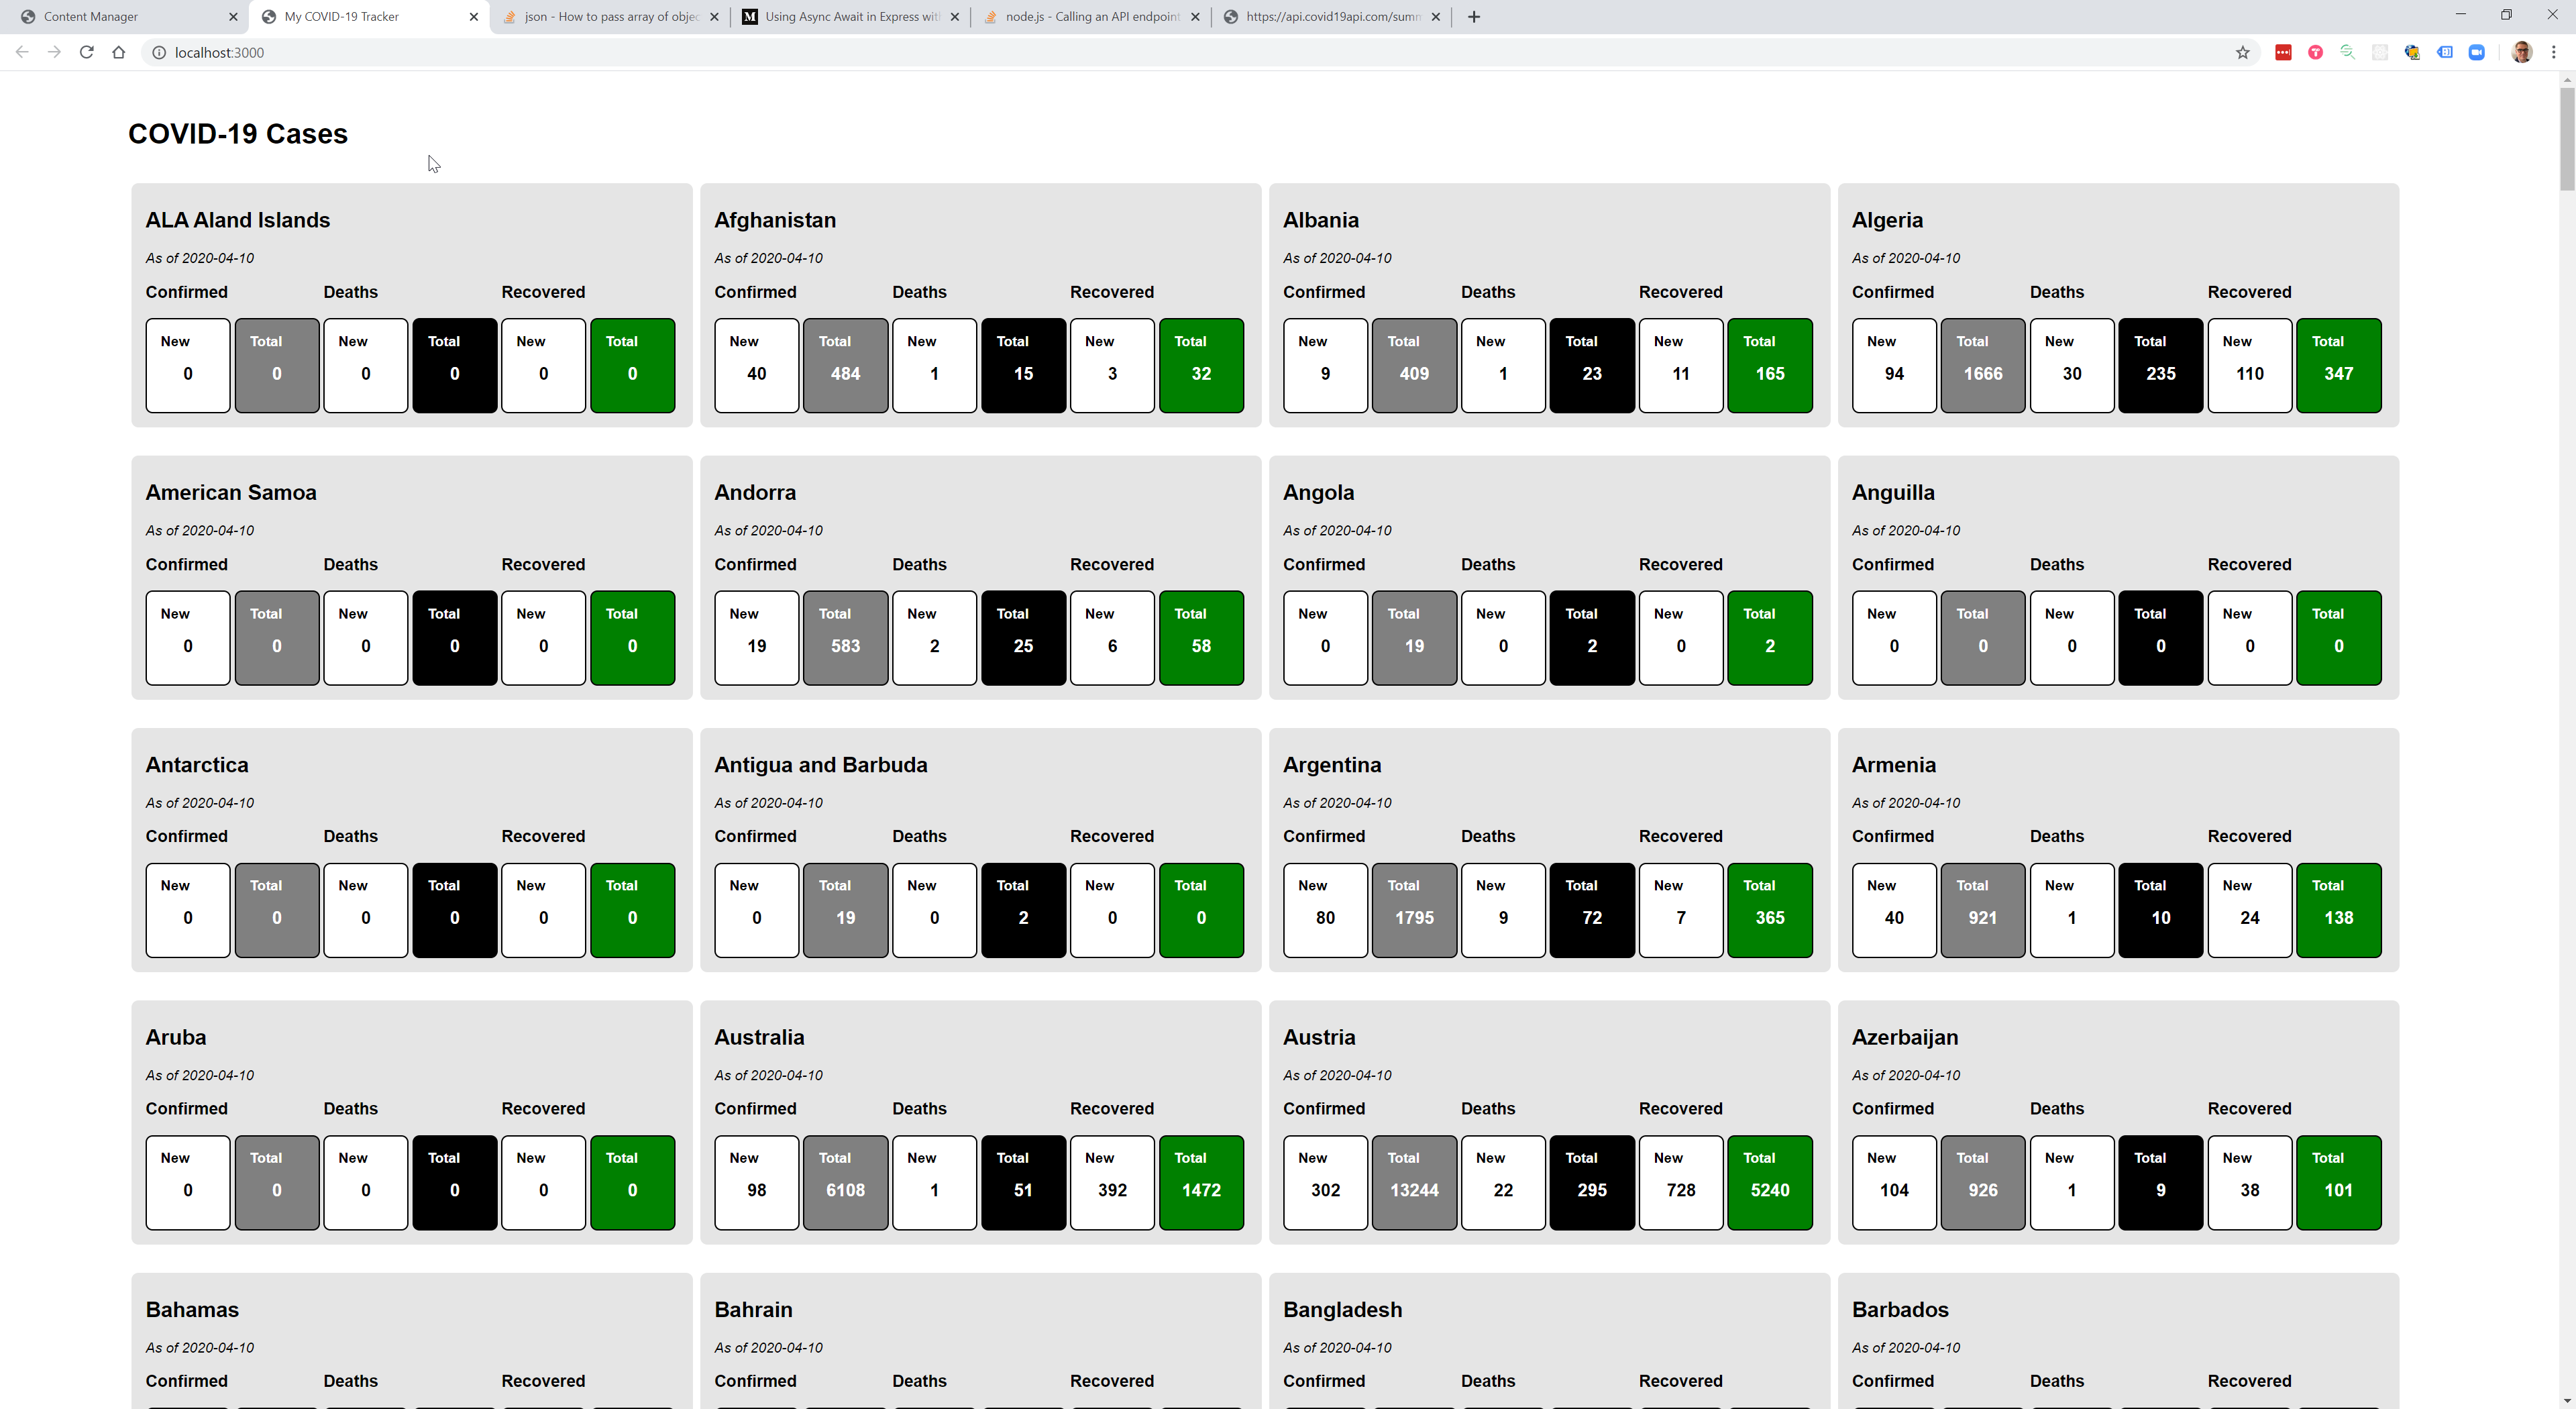
In our previous tutorial, we created a COVID-19 Tracker. The user interface was much like that cluttered artist studio. Rather than helping the user focus, we bombarded them with information. What can we do to make this information easier to digest?

Prerequisites
Before completing this tutorial, complete the first tutorial or clone the Github repository for the tutorial. You will start to see comments in the code examples. Comments allow developers to leave context for those who follow, but have no impact on the execution of code.
/*
Here is a block comment.
It spans multiple lines.
*/
// This is a single line comment.
Providing Context and Focus
There are some simple things we can do to get started.
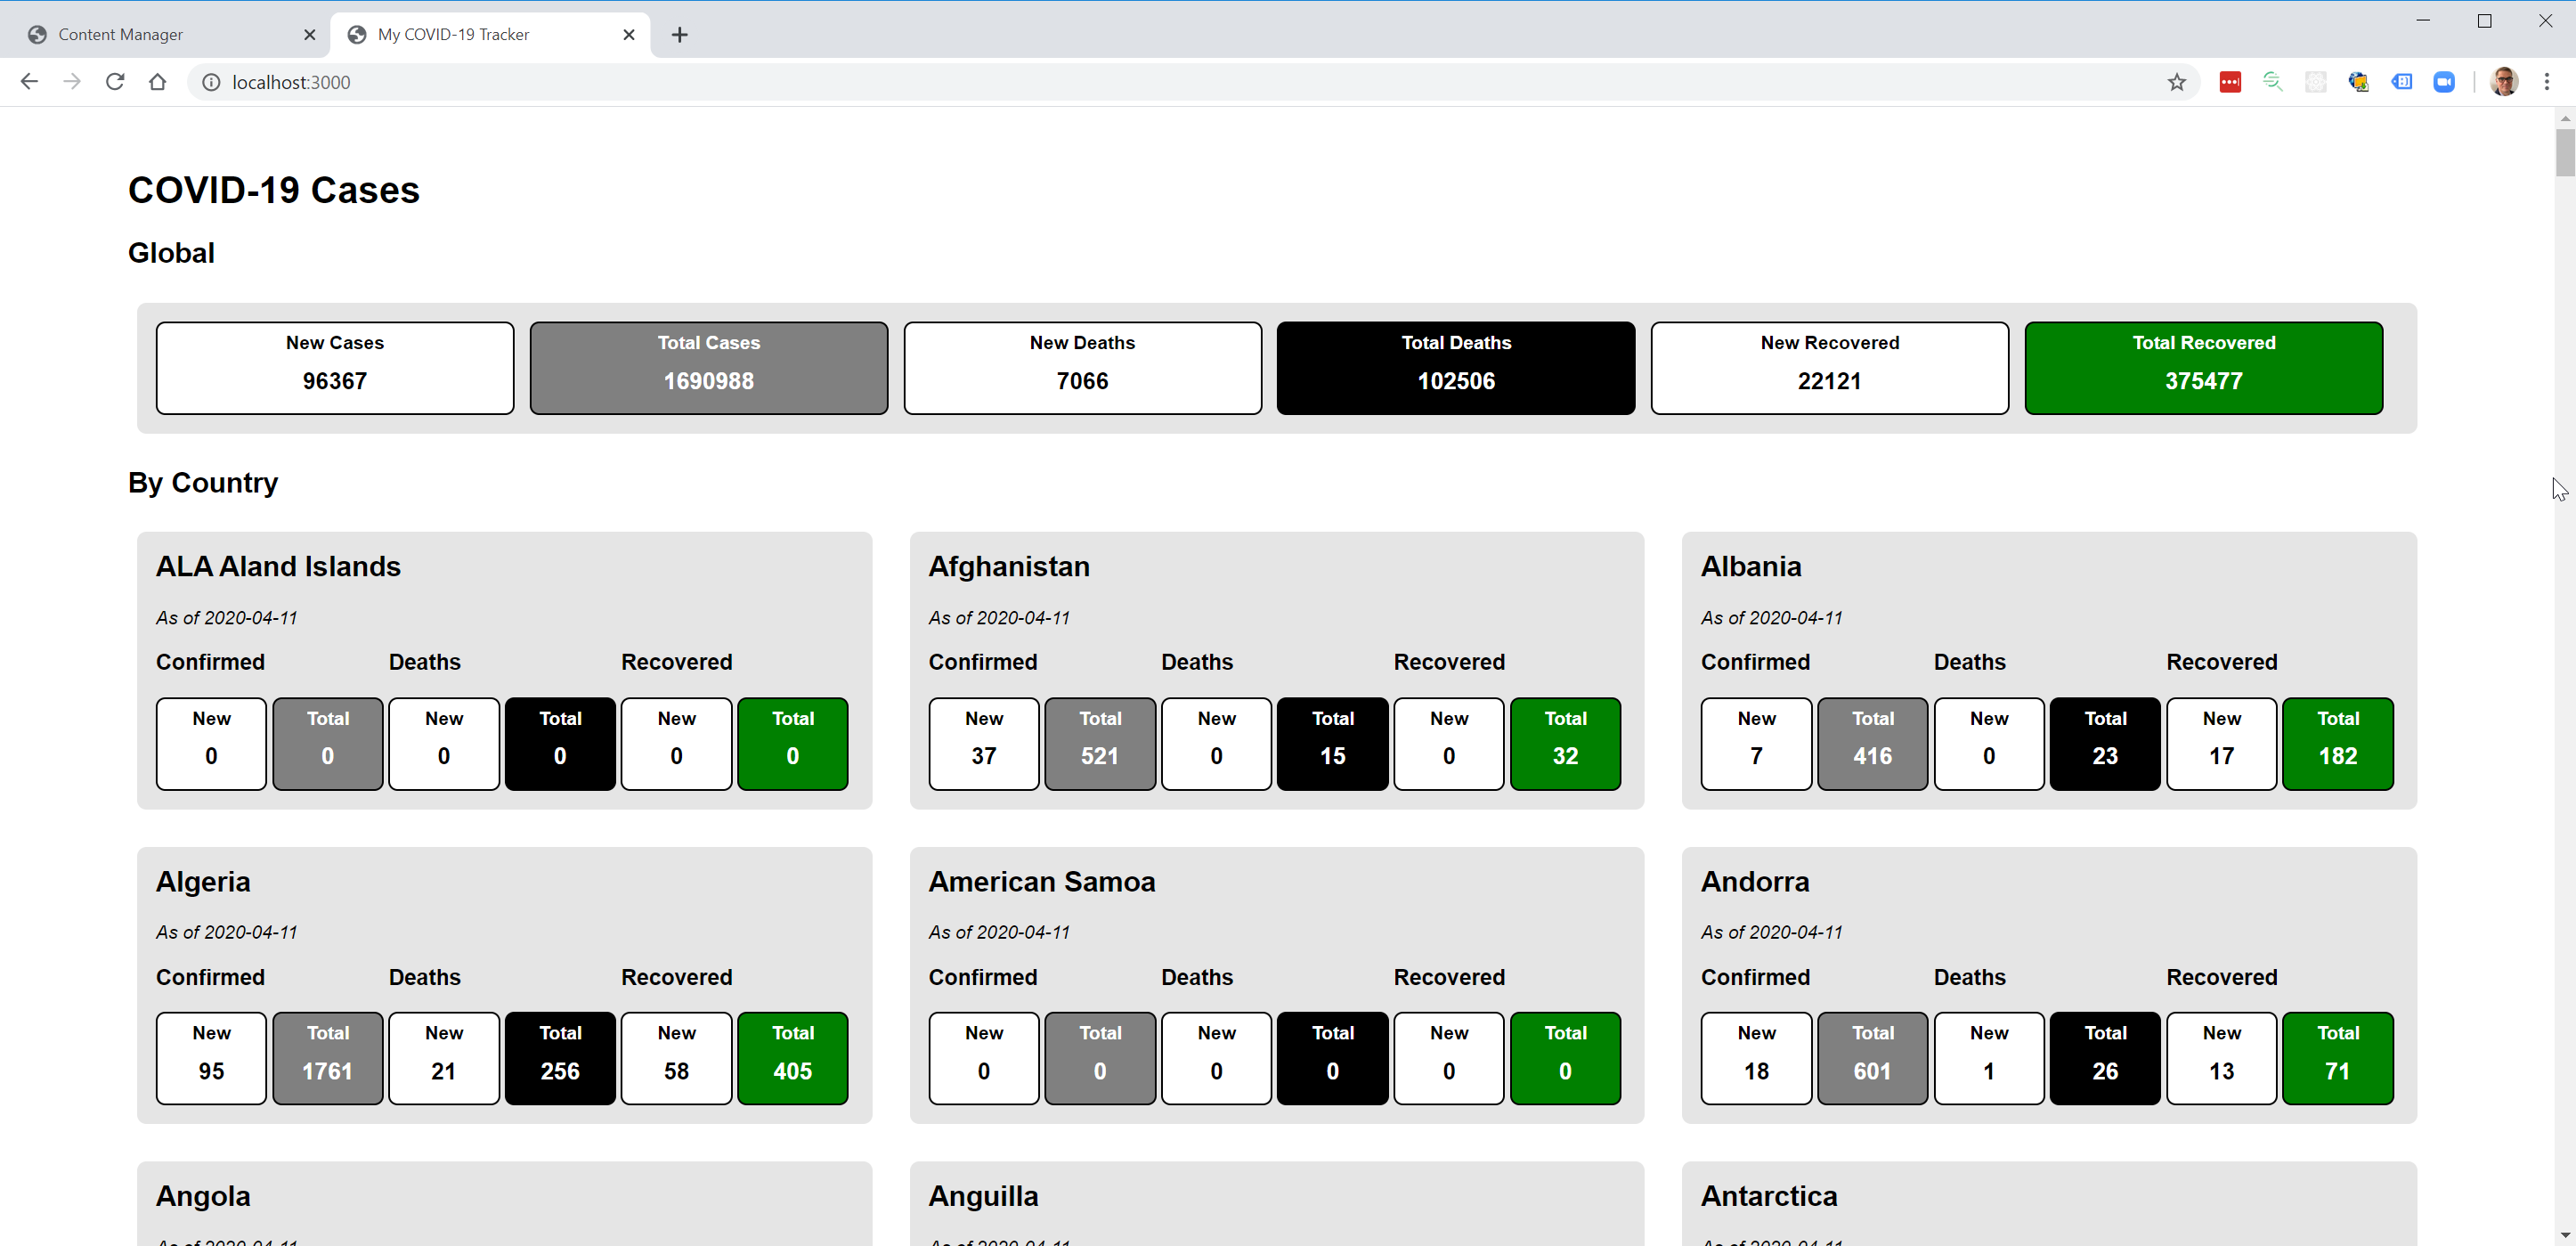
- Provide summary information by displaying the global statistics
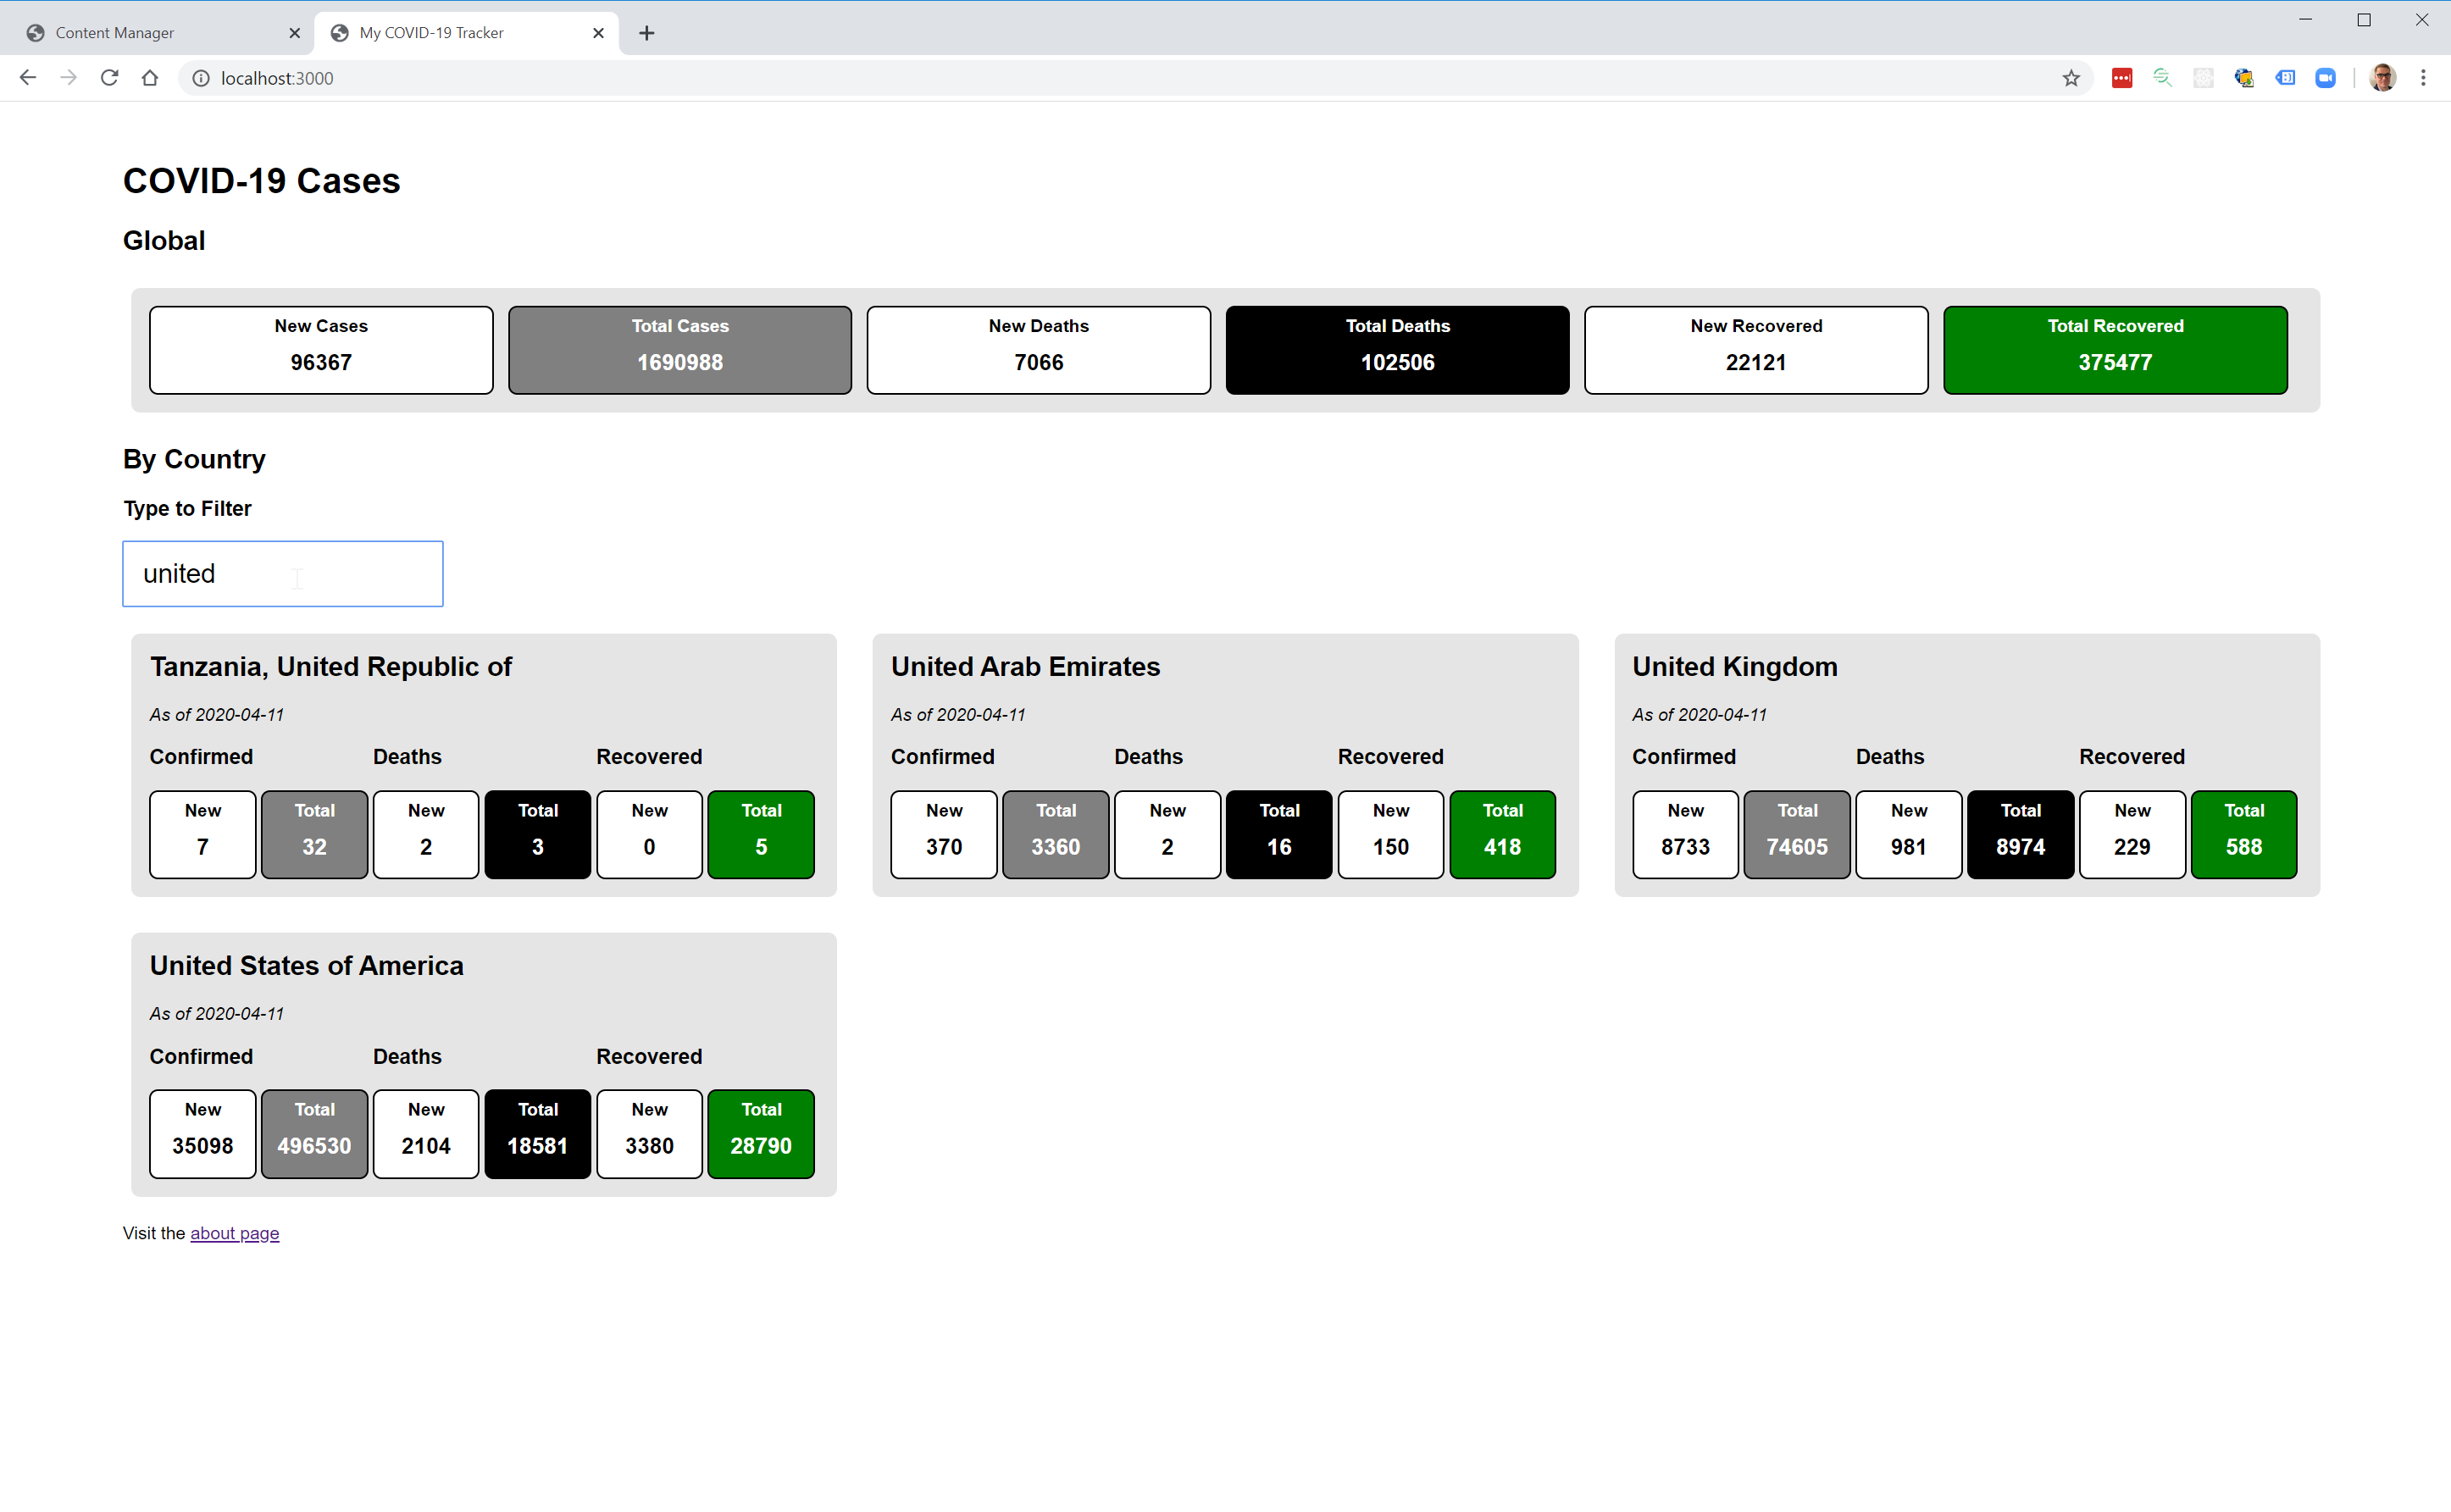
- Allow our users to filter countries by name to reduce the feeling of information overload
Adding a Global Summary
New Data for Our Template
The data our API call returns has both a Countries array and a Global object. You can learn more about JavaScript objects. We need to pass all the data to our Home Page. Open the routes.js file and change the render call for the Home Page Route.
res.render("home", {
  appName: "My COVID-19 Tracker",
  pageName: "COVID-19 Cases",
  data: response.data, // previously: response.data.Countries
});
Our Home Page view expects to be given an array of countries, and not an object containing Global data and an array of Countries. Replacing lines 5-6 of our home.pug file will keep it from breaking.
        h2 By Country
        .cards
            // Our Countries array is now at data.Countries.
            each val, index in data.Countries
This adds a new heading By Country and looks for the countries list inside the data object.
Displaying the Global Summary
To display the new Global Summary data, add a new section above the list of countries in the home.pug template.
    .centered
        h2 Global
        .centered
            .cards.large
                .card
                    .row
                        .cases
                            .row
                                .new
                                    h4 New Cases
                                    .count #{data.Global.NewConfirmed}
                                .total
                                    h4 Total Cases
                                    .count  #{data.Global.TotalConfirmed}
                        .deaths
                            .row
                                .new
                                    h4 New Deaths
                                    .count  #{data.Global.NewDeaths}
                                .total
                                    h4 Total Deaths
                                    .count  #{data.Global.TotalDeaths}
                        .recovered
                            .row
                                .new
                                    h4 New Recovered
                                    .count  #{data.Global.NewRecovered}
                                .total
                                    h4 Total Recovered
                                    .count  #{data.Global.TotalRecovered}
Update Styles
The country data in our previous tutorial was displayed using a FlexBox Grid. However, CSS also has a specification for grid layout that is more effective for our purposes. You can learn more about FlexBox Grid and CSS Grid to round out your skills.
Replace the entire contents of your style.css file with the code below and save your changes.
html,
body {
  margin: 0;
  padding: 0;
}
html {
  font-size: 14px;
  font-family: Arial, Helvetica, sans-serif;
}
.container {
  width: 90%;
  margin: 0 auto;
  padding: 2rem 0;
}
section {
  padding: 1rem;
}

.cards {
  display: grid;
  grid-template-columns: repeat(1, 1fr);
  grid-auto-rows: auto;
  grid-gap: 1rem;
}

.card {
  flex: 1 0 500px;
  box-sizing: border-box;
  margin: 0.5rem 0.5rem;
  padding: 1rem;
  background-color: #e5e5e5;
  border-radius: 0.5rem;
}
.row {
  overflow: hidden;
}
.row > * {
  width: 33.33%;
  float: left;
}
.card h2 {
  margin-top: 0;
}
.card h4 {
  text-align: center;
  margin: 0;
  padding: 0.5rem 0.5rem;
}
.card .count {
  font-weight: bold;
  text-align: center;
  padding: 0.25rem 0 1rem;
  font-size: 1.25rem;
}
.card .new,
.card .total {
  width: 48%;
  margin-right: 2%;
  padding: 0;
  border-radius: 0.5rem;
  border: 1px solid black;
  box-sizing: border-box;
}
.card .new {
  background-color: #fff;
}
.card .total {
  color: #fff;
  background-color: gray;
}
.card .deaths .total {
  color: #fff;
  background-color: black;
}
.card .recovered .total {
  color: #fff;
  background-color: green;
}

@media screen and (min-width: 60rem) {
  .cards {
    grid-template-columns: repeat(2, 1fr);
  }
  .cards.large {
    grid-template-columns: repeat(1, 1fr);
  }
}

@media screen and (min-width: 100rem) {
  .cards {
    grid-template-columns: repeat(3, 1fr);
  }
  .cards.large {
    grid-template-columns: repeat(1, 1fr);
  }
}

@media screen and (min-width: 140rem) {
  .cards {
    grid-template-columns: repeat(4, 1fr);
  }
  .cards.large {
    grid-template-columns: repeat(2, 1fr);
  }
}

.error {
  font-size: 1.7em;
  color: red;
}

/* Forms */

input {
  font-size: 1.5rem;
  padding: 0.8rem 1rem;
  width: 18rem;
}
Check Your Work
Verify this change by starting your server (npm start in your Terminal) and navigating to http://localhost:3000. If it is already running, restart it (Ctrl+C followed by npm start). The global data and list of countries from our previous tutorial should display.

Save Your Work
In your Terminal save your changes with Git.
git add .
git commit -m "Adding global summary data."

Filtering The List
Client Side JavaScript
So far, we have been writing JavaScript to load data from an external API and render HTML in a browser. No JavaScript has executed in the context of the browser. It has been executed by Node.js and Express to produce our results. This is server side JavaScript.
When we filter our list of countries based on user input, we want to avoid the time it takes to query a remote data source. We already have our list. Let’s just choose what we display based on user input. All of this will happen inside the Web browser window. This is client side JavaScript.
Open the home.pug file and look for the line h2 By Country to make some changes. Change the lines below.
    .centered
        h2 By Country
        .cards
            // Our Countries array is now at data.Countries.
            each val, index in data.Countries
                .card
Your new Pug code will be a bit more complex.
    .centered#countryList
            h2 By Country
            h3 Type to Filter
            form(onSubmit="handleSubmit(event)")
                input#needle(placeholder="Country name", onkeyup="handleKeyup(event)")
            // This JavaScript will run in the Web browser.
            script(type="text/javascript").
                filter = (needle) => {
                    const cards = document.querySelectorAll('#countryList .card');
                    cards.forEach(el => {
                        const name = el.getAttribute('data-name').toLowerCase();
                        const isMatched = name && name.indexOf(needle) !== -1;
                        el.style.display = isMatched ? 'block' : 'none';
                    });
                }
                handleSubmit = (e) => {
                    e.preventDefault(); // Prevent the form from reloading the page. We're handling this with JavaScript.
                };
                handleKeyup = (e) => {
                    // Filter whenever content is entered.
                    const needle = e.target.value.toLowerCase(); // Get the filter value.
                    filter(needle);
                };
            .cards
                // Our Countries array is now at data.Countries.
                each val, index in data.Countries
                    .card(data-name=val.Country.toLowerCase())
Note: A word of warning. If you haven’t discovered it yet, Pug uses semantic white space. Languages such as Python and CoffeeScript also follow this pattern. In these languages indention is of extreme importance. When a line is indented more than a previous line, it implies a parent/child relationship.
Some developers love using indention to describe relationships between objects. Others feel it is harmful. Below is an example to illustrate the parent/child concept.
p Hello
  span World

p Hello
span World
The Pug template is compiled to HTML.
<p>Hello <span>World</span></p>
<p>Hello</p>
<span>World</span>
The client side JavaScript illustrates some key concepts you will want to learn.
Each of these concepts merits deep study. The most effective deep study is play. Look over the concepts and try them out. What do they do? How do they break? Learning requires the discovery of misconceptions. Mistakes are a must-have for effective growth.
Check Your Changes
Verify the client side filter you added by starting your server (npm start in your Terminal) and navigating to http://localhost:3000. If it is already running, restart it (Ctrl+C followed by npm start). We should be able to enter text and see our list of countries filter.

Save Your Changes
In your Terminal save your changes with Git.
git add .
git commit -m "Added country list filter."
What We Have Learned
Congratulations! You have built a Web application with both server side and client side JavaScript and learned some valuable skills!
- the importance of providing context and removing clutter
- how data is passed between a router and view and accessed via properties
- an overview of the options for rendering a grid view in CSS
- the difference between server side and client side JavaScript
- how different languages think about white space
- an overview of JavaScript events, DOM selectors and iterators
Hopefully your COVID-19 tracker is working well. A complete archive of code for this Web app is available on Github.

